How can I help
make my retirement income last?
I’m about to retire
and have lost some of my savings due to market declines. What are ways I
can stretch my savings to last into retirement?
If you're currently
retired or getting close to it, you have less time to recover from
fluctuating markets and economic uncertainty. Will your money last?
Should you reduce your exposure to stocks? If you got out of the market,
when should you get back in? These are likely some of the questions
going through your mind.
To help answer these questions Fidelity
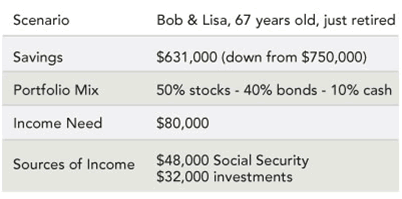
"ran the numbers" using a hypothetical retired couple. We examined the
impact of changes that they can make to their investment mix or
lifestyle to help make their savings last during a market downturn.

Using Fidelity's Retirement Income Planner1 (log in required),
Bob and Lisa found that with this strategy, their original portfolio had
an 89% chance of lasting for 27 years, until they are 93.
Impact
of market volatility
Due to a steep market decline, the
couple's portfolio lost about 16% of its value and was down to just
below $631,000. The same $32,000 in income that they need from their
investments now requires a 5.1% withdrawal rate, which will affect how
long their money will last.
Because of the change in their
situation, Bob and Lisa need to take another look at their portfolio.
Will their original plan still work for them? What can they do to make
sure their portfolio can still provide them with the income they need?
The first thing the couple should do is make sure that their
investment mix still reflects their risk tolerance. If they've never
assessed their tolerance for risk, they should do so. Or, if market
events have caused their appetite for risk to change, their investments
should be aligned with that.
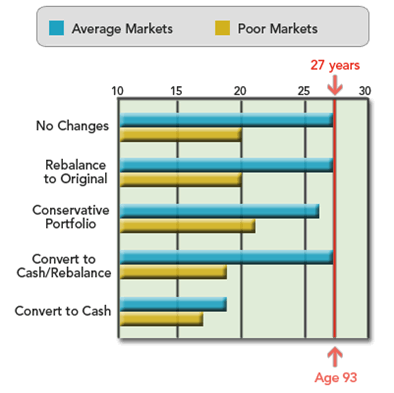
Fidelity evaluated five common
investor reactions to significant market declines and applied them to
Bob and Lisa's situation:
- Make no
changes to their investment mix.
- Rebalance to their original
investment mix of 50% stocks, 40% bonds, and 10% cash because the market
decline changed their mix.
- Change their mix to a conservative
portfolio—50% bonds, 20% stocks, and 30% cash.
- Convert to all
cash until the market stabilizes, and then back to their original
portfolio mix of 50% stocks, 40% bonds, and 10% cash.
- Convert
their entire portfolio into cash and leave it that way.
How
long Bob and Lisa's portfolio may last1

As the chart shows, in average
markets, four of the approaches could still come close to meeting
their requirements. But if they convert to all cash, they will run out
of money before they are 93.
When market returns are poor,
however, in each approach their money would fall significantly short of
what they need. If they want to be more confident that their money will
last, there is more they can do in addition to adjusting their
investment mix. They can also consider the following lifestyle changes:
- Delay Social Security payments— This
strategy will typically mean higher payments later in retirement. And
the longer they delay (up to age 70), the higher the payments may get.
- Work part time for the first few years of retirement— This
may help them cover expenses with earned income, allowing them to
withdraw less from assets, thereby preserving more of their portfolio.
- Revisit budgets and withdrawal rates— Reducing yearly
expenses by $5,000, and the amount withdrawn from their portfolio to
$27,000 from $32,000, may help alleviate the need to sell investments in
a down market. It may also leave Bob and Lisa better positioned to reap
the benefits of stronger returns when markets recover.
- Skip
cost-of-living adjustments— These adjustments are one way of
ensuring that income can keep up with rising costs. However, if their
goal is to have their assets last, skipping these adjustments and
withdrawing $32,000 a year for five years, instead of giving themselves
an annual raise, may help in the long run.
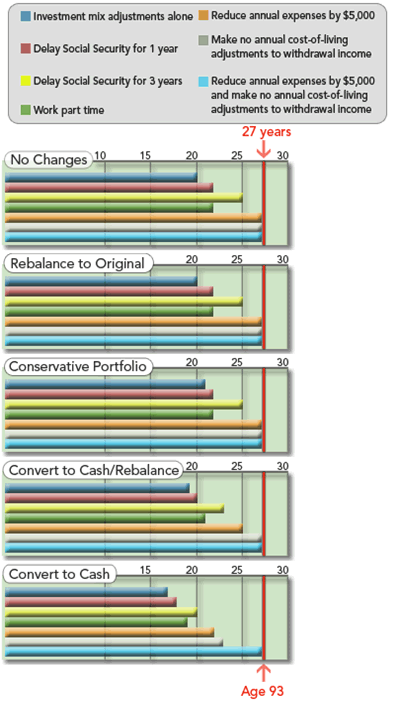
The chart below
shows how these lifestyle adjustments coupled with changes to their
investment mix, may affect how long Bob and Lisa's money may last in a
poor market.1
Impact of lifestyle changes on Bob and
Lisa's portfolio

For example, if Bob and Lisa had
decided that they wanted to stay in a conservative portfolio, several
of the lifestyle changes (skipping inflation adjustments, reducing
expenses, or both) will get them to their goal even if markets continue
to perform poorly.
If they are adamant about an all-cash
portfolio during their full retirement, Bob and Lisa can do it, but they
would need to both reduce their expenses significantly ($5,000 in this
example) and stick to that lower budget for the next five years. For
many investors, this would not be easy.
While an all-cash
portfolio may reduce the chances of your money lasting as long as you
need it, retirees should consider keeping 3-5 years of living expenses
in cash. This will help them avoid having to sell investments in a down
market in order to meet expenses.
Ultimately, every person's
situation and needs are different, and there is no single strategy or
course of action that is right for everyone. These examples, however,
show that small changes can make a difference, and a combination of
portfolio and lifestyle adjustments may have the best chance of success.
How Fidelity can help
- Evaluate
your tolerance for risk and get an appropriate investment mix with
Fidelity's Portfolio
Review2 (log in required).
- Compare your expenses
to income, see how long your money may last, and create an income plan
with Fidelity's Retirement Income Planner (login required).
- Consider
key factors before taking Social Security.
- Learn about guaranteed3retirement
paychecks.
- Call (800) 343-3548 to speak with a Fidelity
planning consultant about strategies that may be appropriate for you.
1. Source for charts, information, and scenarios:
Fidelity Strategic Advisers, Inc. using the Fidelity Retirement Income
Planner, an educational tool developed and offered for use by Strategic
Advisers, Inc., a registered investment adviser and a Fidelity
Investments company. Average rates of return for stocks, bonds,
short-term investments, and inflation are based on the risk premium
approach. Actual rates of return may be more or less. The charts are for
illustrative purposes only and are not indicative of any investment. Past
performance is no guarantee of future results.
The
charts are not intended to project or predict the present or future
value of the actual holdings in a participant's portfolio or the
performance of a given model portfolio of securities. Several hundred
financial market return scenarios were run to determine how the asset
mixes might have performed. The Average Market and Extended Down Market
results are based on 50% and 90% confidence levels, respectively. The
results for the Average Market highlight the number of years the
hypothetical portfolio would have lasted in 50% of the scenarios. The
results for the Extended Down Market are based on a 90% confidence level
highlighting the number of years the portfolio would have lasted in at
least 90% of the scenarios generated.
Higher confidence levels
assume more conservative estimates of market performance, while lower
confidence levels assume more optimistic levels of market performance.
For example, a confidence level of 90%, means that in 90% of historical
scenarios analyzed, a similar asset allocation performed at least as
well as the market. Conversely, in 10% of the scenarios, a similar asset
allocation performed below the market. For a confidence level of 50%,
the sample portfolio did at least as well as the market in 50% of the
scenario, and did not do as well in the other 50% of the scenarios.
The
estimated returns for the stock and bond asset classes are based on a
risk premium approach. The risk premium for these asset classes is
defined as their historical returns relative to a 10-year Treasury bond.
Risk premium estimates for stocks and bonds are each added to the
10-year Treasury yield. Short-term investment asset class returns are
based on a historical risk premium added to an inflation rate, which is
calculated by subtracting the Treasury Inflation-Protected Securities
(TIPS) yield from the 10-year Treasury yield. This method results in
what we believe to be an appropriate estimate of the market inflation
rate for the next 10 years. Each year (or as necessary), these
assumptions are updated, to reflect any movement in the actual inflation
rate. Volatility of the stock (domestic and foreign), bond, and
short-term asset classes is based on the historical annual data from
1926 through the most recent year-end data available from Ibbotson
Associates, Inc. Stocks, bonds, and short-term investments are
represented by the S&P 500® Index, U.S. Intermediate-Term Government
Bonds, and 30-day U.S. Treasury bill, respectively. Annual returns
assume the reinvestment of interest income and dividends, no transaction
costs, no management or servicing fees, and the rebalancing of the
portfolio every year.
The purpose of these hypothetical
illustrations is to show how portfolios may be created with different
risk and return characteristics to help meet a participant's goals. You
should choose your own investments based on your particular objectives
and situation. Remember, you may change how your account is invested. Be
sure to review your decisions periodically to make sure they are still
consistent with your goals. You should also consider all of your
investments when making your investment choices.
Important: Any
projections regarding the likelihood of various investment outcomes are
hypothetical in nature, do not reflect actual investment results, and
are not guarantees of futures results. Over time, results may vary with
each use.
2. Portfolio Review is an educational tool.
3.
Guarantees are subject to the claims-paying ability of the issuing
insurance company.
Before investing,
consider the fund's and/or annuity's, investment objectives, risks,
charges and expenses. Contact Fidelity for a prospectus/fact kit
containing this information. Read it carefully.
Fidelity
Brokerage Services LLC, Member NYSE, SIPC, 900 Salem Street, Smithfield,
RI 02917
535916.1.2 | 535916.2.2 (p)


